ExtraView can produce pie charts, bar charts, stacked bar charts, area charts, line charts, pareto charts, control C charts and control U charts. The following are examples of charts that can be created.
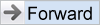
Pie Charts
- Chart Statuses on any date from the current date back through any date in history
- Chart Statuses across products from the current date back through any date in history
- Value-based pie charts show the distribution of values within any field, at the current date.
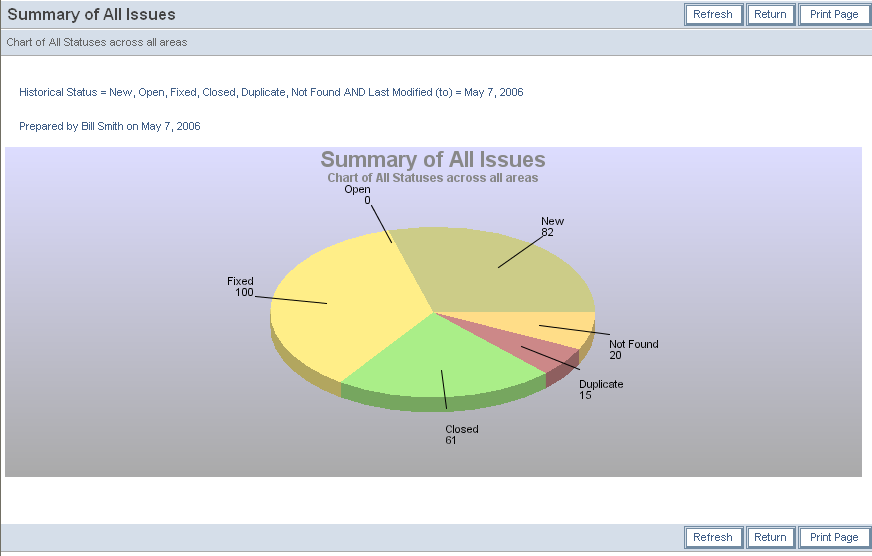
Bar charts
- Chart Statuses over a range of dates
- Chart Status(es) across products over a range of dates
- Value-based bar charts allow the selection of one or two fields. With one field, the values are displayed on the X-axis and the count of values is displayed on the Y-axis. With two fields, the values in the first field are plotted on the X-axis against the values in the second field on the Y-axis.
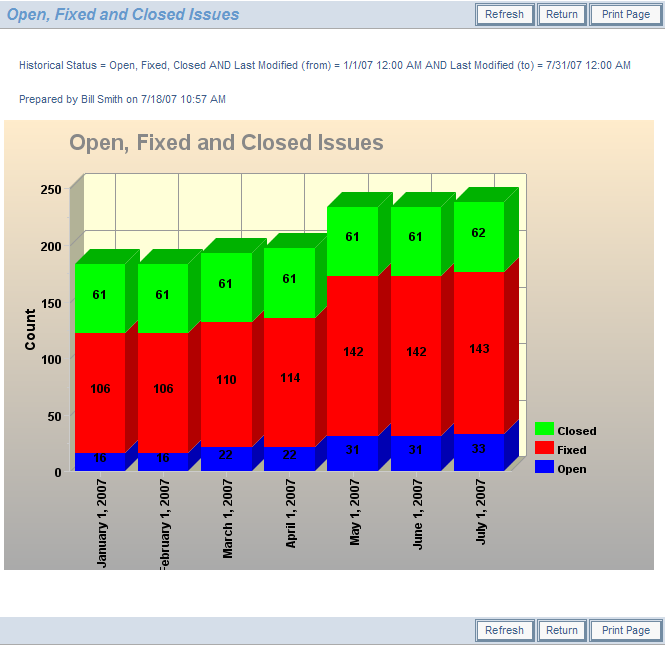
Stacked bar charts
- Chart Statuses over a range of dates
- Chart Status(es) across products over a range of dates
- Value-based bar charts allow the selection of one or two fields. With one field, the values are displayed on the X-axis and the count of values is displayed on the Y-axis. With two fields, the values in the first field are plotted on the X-axis against the values in the second field on the Y-axis.
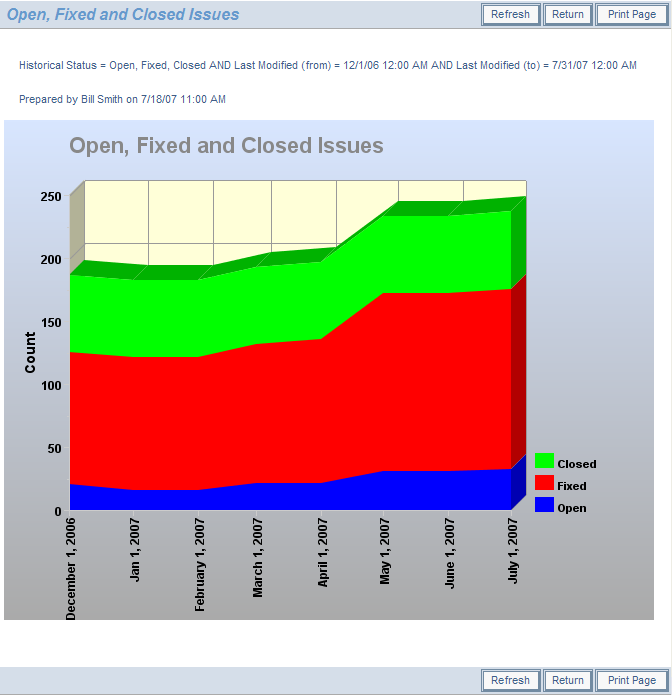
Area charts
- Chart Statuses over a range of dates
- Chart Status(es) across products over a range of dates
- Value-based bar charts allow the selection of one or two fields. With one field, the values are displayed on the X-axis and the count of values is displayed on the Y-axis. With two fields, the values in the first field are plotted on the X-axis against the values in the second field on the Y-axis.
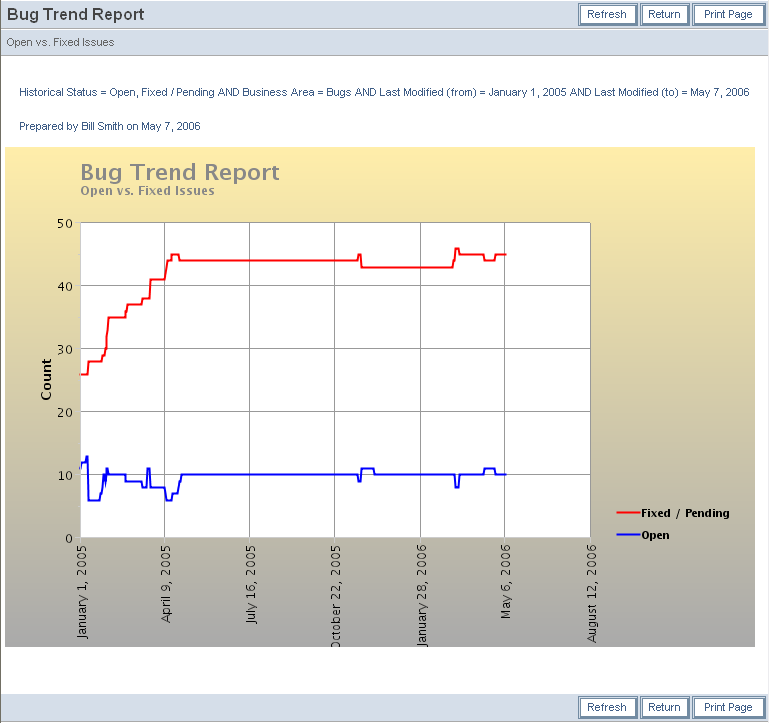
Line charts
- Chart Statuses over a range of dates
- Chart Status(es) across products over a range of dates
- Value-based bar charts allow the selection of one or two fields. With one field, the values are displayed on the X-axis and the count of values is displayed on the Y-axis. With two fields, the values in the first field are plotted on the X-axis against the values in the second field on the Y-axis.
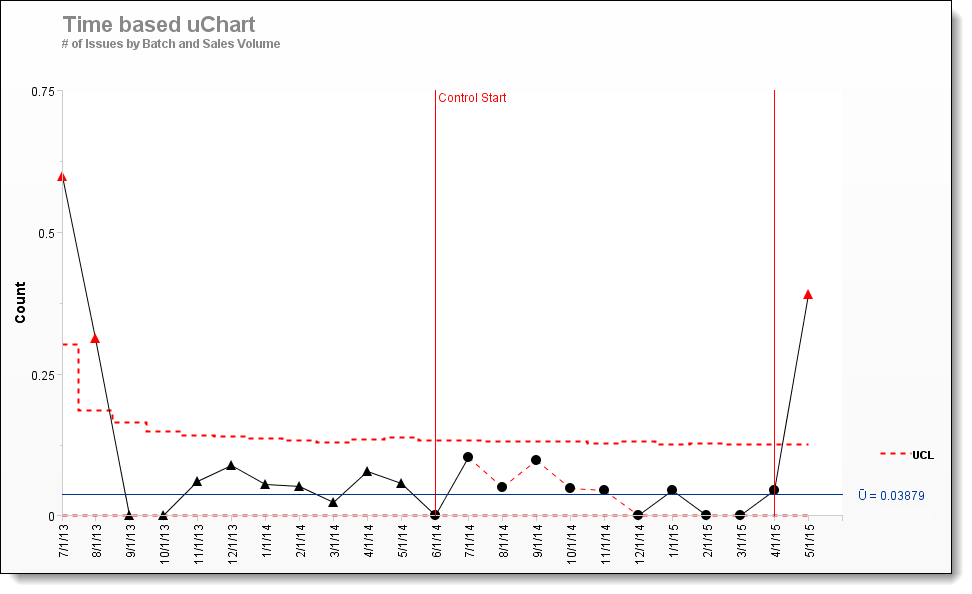
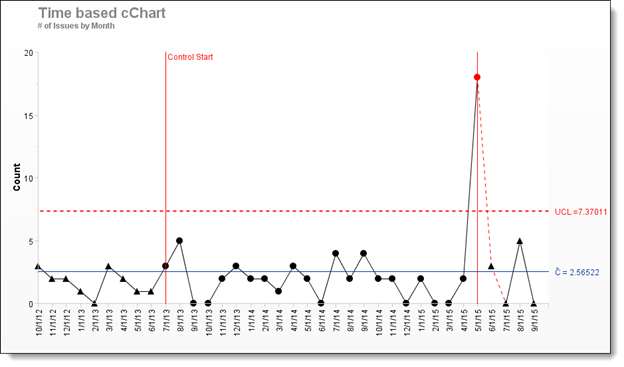
uChart & cChart Control Charts
Control charts are used to help identify if business and/or manufacturing processes are currently under control, and to also predict future performance. If the process is out of control, the chart can be used to help identify areas that require further analysis. Please consult the end user documentation for more information.
Additional information: http://docs.extraview.com/extraview-23/end-user-guide/reporting/report-types/charts